Reuse atlas
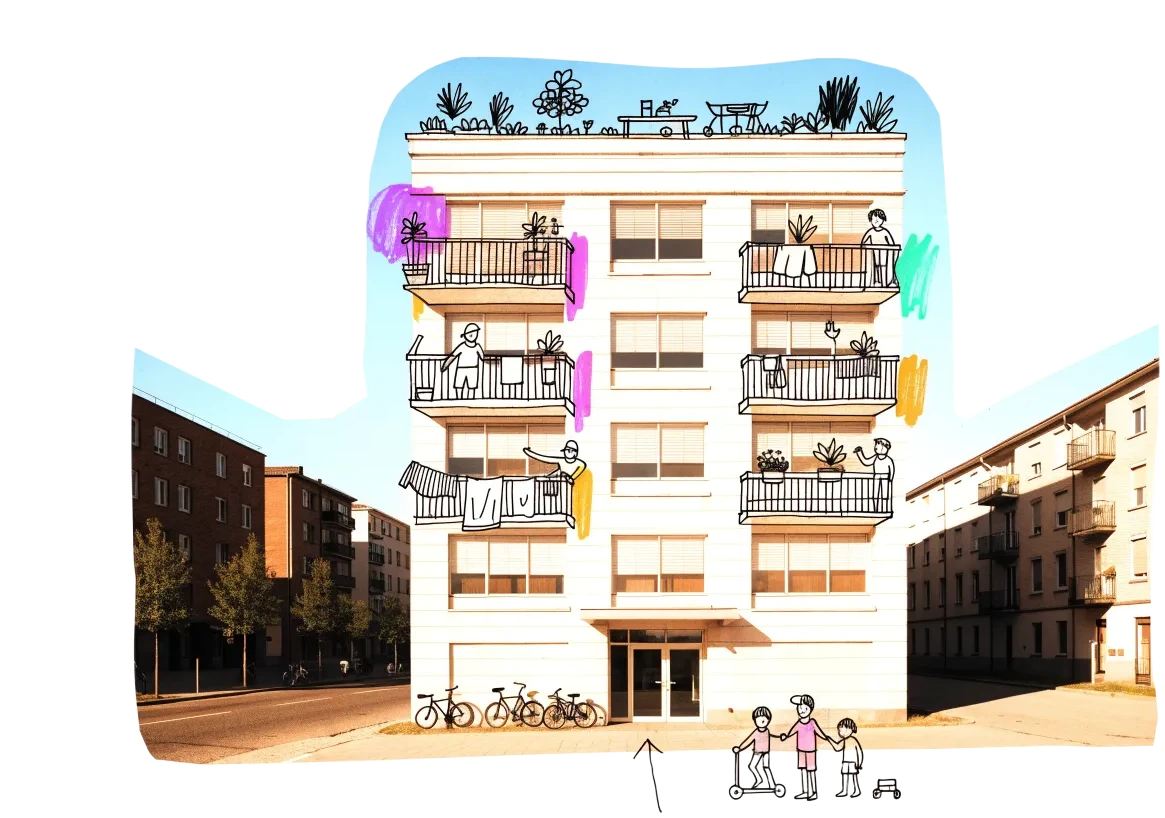
How a reuse radar works
- 1
Every lawful source on one map
Buildings the official cadastre flags unused, public land, forced auctions, brownfields and offices shallow enough for daylit flats — only data we may reuse, each point with its source and date.
- 2
A score you can read
Size, plan depth, a station nearby, a zone that allows homes and affordable land — cheap land counts in a building's favour, because that is what a cooperative can afford.
- 3
Checked by people
The data cannot tell whether a building is really empty. Visitors report what they see, and we check every report before it reaches the map.
16 cities, building by building
Each dot is a city radar — the bigger the dot, the more buildings and sites on it. Open a city to see its map, where to look first, the districts worth a closer look and who to talk to.
Germany
Across Europe
One building in every city
The strongest candidate on each radar — a building checked and found empty where we have one, otherwise the top of its list. Scores compare buildings within a city, not across cities: every radar is built from different open data.
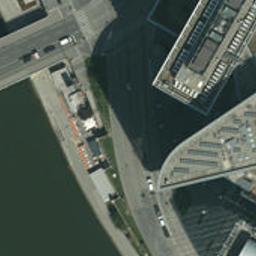
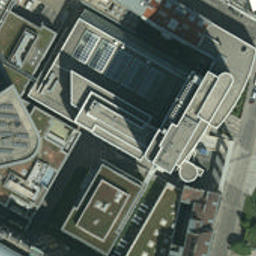
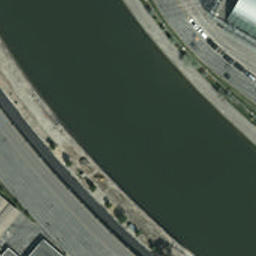
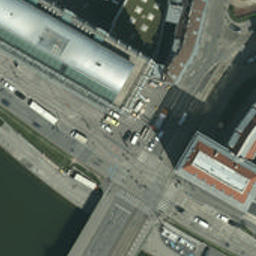 ViennaObere DonaustraßeOffice or work building · score 58 · checked: emptyOpen its card
 Across Europe
How many homes empty offices could become, city by city and country by country. Move the convertible share to see the range.
Where the conditions line up
Three separate tests, not a blended score: an office glut, a housing market with no slack, and a country that will say yes to a change of use.
How this is put together
The Europe-wide figures come from our curated office-vacancy research and the conversion engine behind the economic model: vacant floor area, a convertible share, 80% net residential area and 66 m² per home — an order of magnitude, not a forecast. The city radars are built from public records and open data we are allowed to reuse; where a publisher blocks automated access we do not work around it, we ask. The full reasoning is in Turning empty offices into homes.