A housing coop that crosses borders
Local cooperatives own the homes. A European cooperative brings the buildings, the patient capital and the shared platform. How the pieces fit, where the money flows, and what could go wrong.
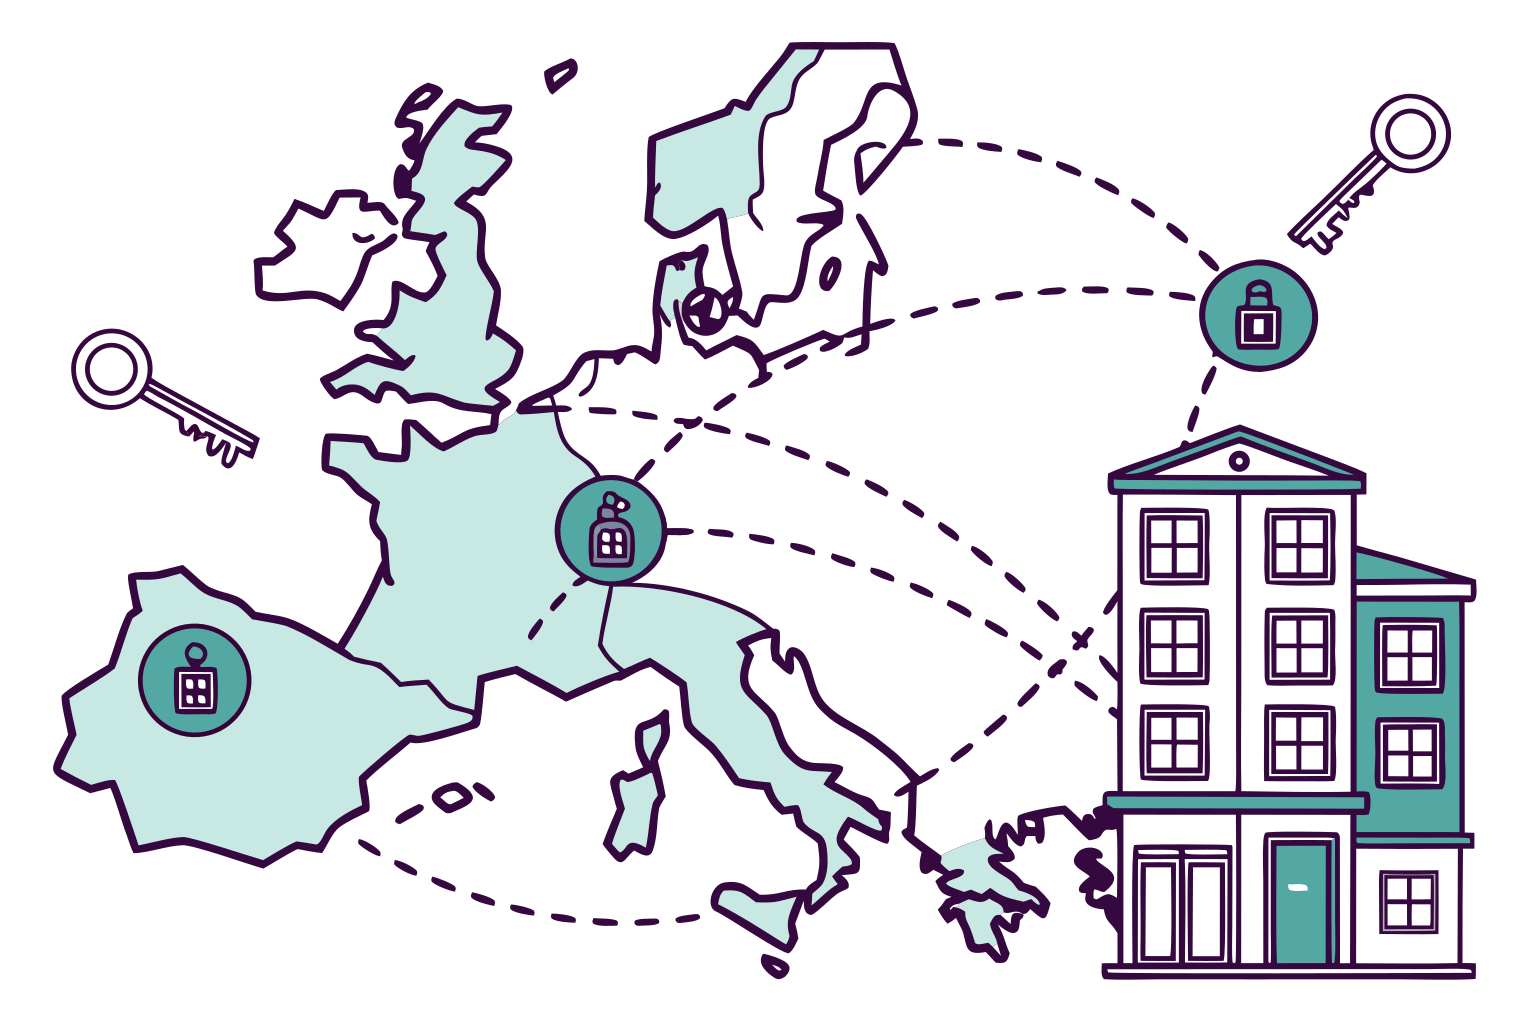
Why would a housing coop cross a border?
Almost everything that makes a home work is local: the building, the neighbours, the boiler, the rules people can live with. Put an office in another country between residents and those decisions and you have added a layer, not a benefit.
A European tier earns its place only on things that travel. The first is patient money: savings raised where the cooperative tradition runs deep, backing a project where tradition and finance are both thin. It is close to what research for the European Parliament recommends where social housing is scarce.

The second is membership, so that someone who moves city stays inside the same cooperative with a furnished flat to land in. The third is knowledge: financing templates and conversion appraisals a group starting out would otherwise build from nothing.
The timing helps. Affordable housing sits higher on the European agenda than in decades, with a dedicated plan and a parliamentary push behind it. And the legal form exists: the European Cooperative Society, created by Council Regulation (EC) No 1435/2003, gives a cooperative one identity across member states.
It is a thin shell. A synthesis of how the form is used counted 113 registrations in two decades, of which 75 were still active, and found so much left to national law that there is not one European Cooperative Society but thirty.
Two organisations have already tried it, from opposite ends. MOBA Housing SCE federates cooperatives across central and south-eastern Europe from the bottom up, with a shared revolving credit line for projects local banks will not touch. LiM went the other way, a pan-European developer-owner above local partners. Its Berlin pilot was delivered; the cooperative was liquidated in 2025 and the project passed to its local partner.

Neither settles it. MOBA shows coordination and catalytic finance can cross a border. LiM shows that owning the buildings from the centre is the harder half. What is left is the shape Ostrom found in commons that outlast their founders: small units of decision nested inside larger ones. So who has to be in the room?
Who has to be in the room
Stand in the lobby of a former office block on its first morning as housing and count the parties who had to agree. Residents. A local cooperative. Whoever owned the building. The city that granted the change of use. Firms that did the work. Investors who put up the equity. And an umbrella that arrived with the template.
The diagram below sets out what each party puts in and takes out. Look for the asymmetry: the parties with the most money at stake have the least say over daily life.
Residents bring demand and equity, and take a secure home and a vote. The owner brings a stranded asset, usually on a long lease at a ground rent below market, and takes a future for a building nobody wants as offices. The city brings consent, sometimes land, and takes housing it could not deliver alone.
Company members are the awkward ones. A materials supplier, an engineering practice or a proptech firm brings products, appraisal tools and delivery experience, plus share capital and dues. The same firm would also like to win the next contract. Both motives can be genuine, so membership buys no purchasing obligation, conflicts get declared out loud, and an interested member leaves the room for the decision.
Investors bring patient capital and accept a capped return. That is not a generosity invented here. It is close to what the European Parliament's own research proposes as a condition for supporting housing at all: cap the return, block the speculative exit.
Shared purpose is where this starts, not what holds it together. European research on collaborative housing is blunt about what happens next: these alliances survive on terms every party can read, and come apart on the ones only the lawyers understood. So whose money is it?

Whose money builds it
Take one building: a former office of seven and a half thousand square metres, converted rather than demolished, because keeping the structure and the façade is where the money and the carbon are saved. Roughly three-fifths of the cost is borrowed at commercial bank rates. No subsidised debt.
A fifth comes from the people who will use it: residents subscribe a project share per square metre, the ground-floor tenant one in proportion to its area. That money earns nothing. The last fifth is the Fund's catalytic capital, and it is the only money in the building that carries a return.

The stacks below are computed live. Watch how thin the equity layer is beside the debt.
The long-term homes are priced at cost-rent: operating costs, a renewal reserve, debt service and the Fund's fixed return. Nothing else sits inside it. There is no development profit in the rent, because the developer-operator is paid a fee and keeps no stake in the finished building.
Any project can calculate a rent that covers its costs. The harder question is whether it is below market on opening day, and in an expensive city it may not be. Berlin opens slightly above market on private floor area alone, and about 8% below once you count each household's share of the commons. A defensible basis for comparison, and also a choice.
The gap is meant to widen, because the cooperative's charge rises more slowly than market rent. Set the two lines to the same growth rate and the advantage stops growing, leaving only the opening position.
All of that rests on a gap of one and a half percentage points a year between market rent growth and the cooperative's escalation. It is an assumption about landlords, not a finding about cooperatives, and it holds only for high-pressure cities.
For a household there are two numbers: a one-off subscription and a monthly charge. In Berlin the subscription runs at about €800 per square metre of private floor area, roughly €48,000 for a two-person home. A household can carry the monthly charge comfortably and still have no way of finding that.
The figure below follows one household through it, including what changes when entry relief is switched on. It is switched off in the case tested here. Engine-room surplus does not reduce the first cohort's contribution; it is pooled for later buildings, where a later cohort pays in less and the pool covers the difference. Relief is not free: resident capital earns nothing and Fund capital earns the patient return, so swapping one for the other lowers the entry price and raises the rent.
Which leaves the obvious question. If the homes only ever cover their own costs, where does any surplus come from?
The part of the building that pays for the rest
Two slices of the building are not priced at cost. Furnished flats let for three to twelve months, and a commercial ground floor with co-working, food and event space run by an outside operator on a lease. Together they are the engine room.
They earn a premium because they sell flexibility and service, and they cost more to run: turnover, management, empty weeks. What matters is what each use leaves after its own costs. On the model's numbers a square metre of serviced flat clears roughly twice what a long-term home clears, the ground floor about half as much again.
Switch the engine off in the figure below and watch what the rest of the building can no longer afford.
Where it goes is a rule, not a preference. It repays the patient investors first, then enters a pool that funds the next conversion, builds reserves and lowers entry contributions for later cohorts. It does not buy down long-term rents. Residents' rents fall separately, as the homes' own debt is paid off.
The obvious objection deserves a straight answer. Carving serviced flats out of a residential building looks like the thing this model complains about: homes turned into short-let yield. The differences are that these homes are added by converting offices rather than taken from existing stock, cannot be sold at a profit, and are let by the month rather than by the night, with the premium coming back into housing. Whether that survives contact with local short-let law varies by city.
The real exposure is demand. Europe's serviced-apartment market ran near 79% occupancy in 2025, which says there is a market, not that this building will fill. The Berlin case leaves almost no slack: eighteen mid-term flats carrying roughly eighty-one member stays a year, modelled at 96% occupancy, with no allowance for empty weeks. That is the assumption to test first.

Who owns it, who decides, and who is allowed to profit
A building needs an owner, a decision-maker, a builder and a funder. Those roles can sit inside one organisation. Keeping them apart is what makes it possible to see who carries which risk.
Each tab in the figure below is one of the four roles. The one to read twice is the funder.
The building sits in a local project vehicle. The resident cooperative controls it, and its share of the equity climbs towards roughly nine tenths as the outside money is repaid. The developer-operator is paid a fee. It holds no equity and no upside, which is deliberate: nobody here gets richer because the building did.
The Fund supplies the patient equity — the fifth of the cost that carries a return — and it is built to leave. As the building repays it, the residents’ share climbs and EHC settles at roughly a tenth, the stake that sits behind its veto. The Fund is open to members and non-members alike, and it is the only vehicle in the structure that is paid anything at all. The return is fixed at 3.5% and capped, below what commercial equity expects and close to what Europe's limited-profit housing systems have long allowed invested capital to earn.
Three money relationships stay separate, and that separation is the design. A membership share buys one vote and no dividend. A project share buys a stake in your own building and earns nothing. A Fund investment earns the capped return and buys no vote. There is no investing-member class here. The European statute permits one, and even allows securities to be issued to non-members.
Drag the year in the figure below. External investors are repaid and leave, the residents' share climbs, and one thing never moves.
That thing is the golden share, and there are two of them: one held by the residents’ cooperative, one by EHC. Selling at market value would repay every investor and undo the reason the building exists, so both have to turn before it can happen. A veto is worth what the statute behind it is worth, which is why the lease, the covenants and the resale cap need local legal review in every country.
One more thing cooperative status does not buy: an exemption from financial regulation. The EU's fund-manager directive classifies a vehicle by what it does rather than what it calls itself, so the Fund's status has to be settled before capital is raised. And a Fund paying one fixed return across the euro area, Sweden and the United Kingdom carries a currency exposure the model does not price.
From one building to fifty
One conversion is a project. The interesting claim is the second one, and how it gets paid for.
Surplus from the first building repays its patient investors, then goes into a pool that funds the next. Members moving between cities fill the serviced flats, which is what generates the surplus. And the platform carries what was learned: what the conversion actually cost against the appraisal, which common rooms residents used, where a clever operating arrangement turned out to be a nuisance.
The count-up below runs from one building to a network. The loop matters more than the total.
Which cities come first is not a matter of taste. The euro area leads, for the currency reason above. After that it goes where three conditions line up: vacant commercial stock a surveyor will certify can take housing, an owner willing to grant a long lease below market ground rent, and a resident group that exists before the building does. Places with a strong cooperative rental sector are the easier build. Places without one are where an umbrella earns the most, because a local group otherwise has to invent the whole model from scratch.
Reporting comes as part of the deal. Every project accounts for money, carbon and how residents actually fare, on a framework drawn from the EU taxonomy and the social-taxonomy work beside it, so residents and capital providers read the same account.
None of this turns by itself. It runs on money the network has not yet earned, from demand nobody has tested at this scale. You can turn the handles yourself: the engine behind every figure here is open at the economic model, where changing a city, a conversion cost or a return shows what gives way first.
What would break it
A design gets more convincing as it gets more detailed, and that is when it deserves the most suspicion. Here is what this one asks the world to supply.
The model was run across thirty-six cities, moving one assumption at a time to a plausible good end and a plausible bad end. The longer the bar, the further that assumption moves the equity a building needs.
Single-factor sweep across 36 cities: the distance between the favourable and adverse end of each assumption, measured in the average equity a building requires. Source: EHC economic model, cross-city break-even sweep
The two longest bars are both about the engine room, and they are different risks. One is price: whether companies and mobile members will pay near-market rates for a serviced flat and a ground-floor lease. The other is occupancy: whether those flats stay full. Either one on its own moves the equity a building needs by more than everything below it put together. No housing cooperative has run this at scale, so there is no precedent to point at. It is the first thing a pilot must test.
Conversion cost comes third, and it is the one you can actually check. Whether a building converts at a discount to new-build depends on that building: its floor depth, its structure, its services, its façade. Guidance written for architects and the European work on office-to-housing agree: good candidates are very good, bad ones are expensive.
The patient return moves the answer far less on its own, and that is the trap. Push the return to 5.5% and the model still works. Push it there when refinancing turns dearer and occupancy is soft, and the levers stop being independent. The base case borrows at commercial rates, coverage must hold for the life of the senior loan, and supervisors have been tightening exactly this lending.
Finding the patient capital is a smaller risk, only because the ask is modest. Roughly one in five impact investors will accept a below-market return, and the concessions they actually make sit in the right range for what this asks. A real pool, and not an unlimited one.
And one risk the chart cannot show. A household that can easily afford the monthly charge may still be unable to find the entry contribution. The engine room lowers that barrier for later cohorts and does nothing for the first. That is where a comparison with social housing should start. None of this is a reason to skip the first building. It is what the first building exists to find out.
References
From our library22
- Housing speculation in the EU: Corporate landlords, real estate trusts, abusive speculative behaviour and impacts on prices and transactions — Knowledge
- The European Affordable Housing Plan — Knowledge
- A coordinated EU approach to housing — Knowledge
- Synthesis report on the application of Council Regulation (EC) No 1435/2003 of 22 July 2003 — Statute for a European Cooperative Society (SCE) — Knowledge
- MOBA Housing SCE — Organisation
- MOBA: Rethinking needs and financing for affordable rent and cooperative housing in Central and South-Eastern Europe — Knowledge
- LiM Living in Metropolises SCE — Organisation
- Governing the commons: The evolution of institutions for collective action — Knowledge
- Collaborative Housing in Europe: Conceptualizing the Field — Knowledge
- Adaptive Reuse for Housing — Knowledge
- Catalytic capital investment as an enabler of affordable rental and cooperative housing - Investor Report — Knowledge
- European Serviced Apartments Report 2026 — Knowledge
- Brick by brick: Building better housing policies — Knowledge
- Ist die Europäische Genossenschaft kapitalmarktfähig? – Zum Anwendungsbereich des Art. 64 SCE-VO — Knowledge
- Non-profit Housing Influencing, Leading and Dominating the Unitary Rental — Knowledge
- Housing Needs and Cooperative Housing Models: A Scoping Review — Knowledge
- EU Taxonomy: Evaluating the Market-Readiness of the EU Taxonomy Criteria for Buildings — Knowledge
- Office to Housing — Knowledge
- Conversion of offices into affordable housing — Knowledge
- Addressing commercial real estate lending risks with borrower-based measures — Knowledge
- State of the market 2025: Trends, performance and allocations — Knowledge
- Impact investing — Knowledge
Further sources6
- European Cooperative Society, created by Council Regulation (EC) No 1435/2003
- EURICSE synthesis report on the SCE Regulation — EURICSE synthesis report on the SCE Regulation
- EHC economic model, year-one affordability discount — EHC economic model, year-one affordability discount
- Savills, European serviced apartments report 2026 — Savills, European serviced apartments report 2026
- The EU's fund-manager directive
- the economic model