Overview of the Report
The document “Transformaties in de woningvoorraad 2024 – kenmerken van woning‑ en pandtransformaties” is a statistical study produced by the Centraal Bureau voor de Statistiek (CBS), the Dutch national statistics office. CBS combines extensive administrative registers and survey data to monitor housing developments across the Netherlands. This 2025‑published study presents the characteristics of housing‑ and building‑level transformations that added 7 870 new dwellings to the national stock in 2024.
Scale of Housing Transformations
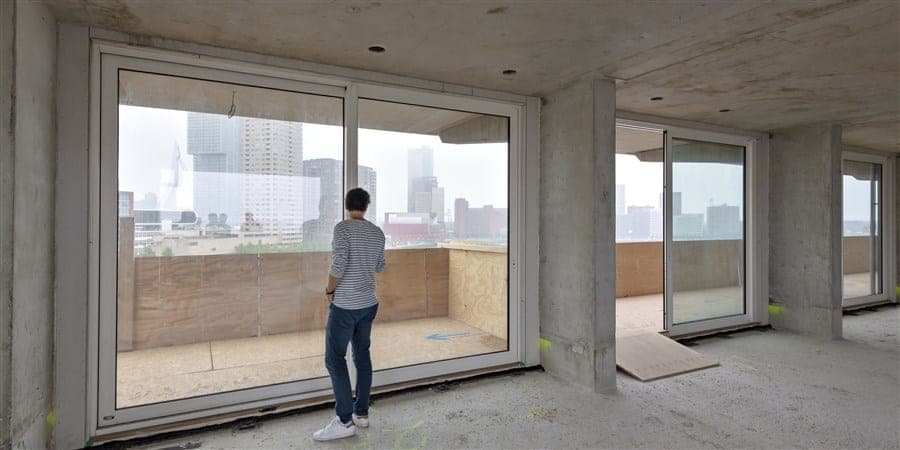
In 2024, 7 9 thousand housing transformations were recorded, creating 7 870 new homes within 2 020 buildings. The majority of these conversions occurred in strongly urban areas (61 %). Most transformed buildings are modest in size: 64 % are under 500 m², and over half (54 %) were built before 1945, indicating a substantial reuse of historic stock.
Geographic Distribution
The highest concentration of conversions was in Zuid‑Holland (25 % of total), with a 33 % increase driven largely by Rotterdam. Eindhoven ranked second nationally, delivering 405 conversions, while Hengelo (O.) contributed 290. Amsterdam experienced a sharp decline, falling to 210 conversions, a 51 % drop from the previous year. Overall, the four leading provinces (Zuid‑Holland, Noord‑Brabant, Gelderland, Noord‑Holland) together account for roughly half of all transformations.
Building Types Before Conversion
Former office buildings dominate the supply of conversion opportunities, with 2 765 units originating from office premises. Their share fluctuated between 28 and 35 % in recent years. Conversions from healthcare facilities fell dramatically, from 665 units in 2023 to 215 in 2024 (‑68 %). Retail premises also declined, from 2 165 to 1 155 units. Remaining categories (e.g., “Other”, “Accommodation”, “Meeting”) show only minor variations.
Ownership and Tenure
Seventy‑three percent of the newly created homes are owned by “other” landlords, slightly down from 77 % in 2023. Owner‑occupied dwellings rose modestly to 18 % from 16 % the year before, while corporate housing (corporate landlords) remained stable at around 8 %. Compared with the overall Dutch housing stock, owner‑occupied units are under‑represented among conversions (57 % of all homes are owner‑occupied).
Household Profile
Of the 7 9 thousand transformed units, more than 5 000 were inhabited as of 1 January 2025 (66 %). Young adults dominate the resident profile: 44 % are aged 18‑27, and 35 % fall into the 28‑44 bracket. Household composition reflects a prevalence of single‑person or child‑free couples, accounting for 89 % of occupied conversions; single households alone represent 62 % of this share.
Transformation Intensity per Building
On average, office buildings generate the most conversions per site, delivering 8.8 new homes per building. However, in 2024 educational buildings produced the highest average, with 14.5 dwellings per site. Typical residential buildings yield between 2.2 and 2.8 units per conversion, while retail sites average around 4 units, with a notable peak in 2023.
Extent of Building‑Level Change
More than half of all building conversions (54 %) involve less than 50 % of the original floor area being turned into housing, indicating partial adaptations. Fully‑or‑nearly‑fully transformed structures (≥75 % of floor area) constitute 33 % of cases, a stable share over recent years. Transformations affecting 50‑75 % of the area are rare (13 %).
Sustainable Implications
The data illustrate a sustained trend toward re‑using existing urban fabric, especially older, pre‑1945 buildings, to meet housing demand. By focusing on partial conversions and preserving substantial portions of historic structures, the Dutch approach aligns with circular‑economy principles and reduces the need for new construction, contributing to broader sustainability goals in the European housing sector.